Tableau • Sales Analytics • Customer Analytics • KPI Reporting
Tableau Sales & Customer Dashboard
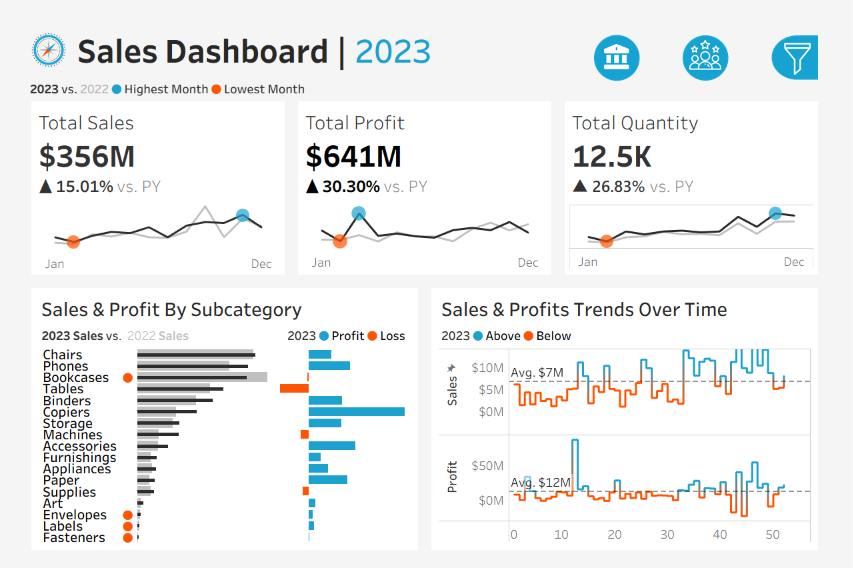
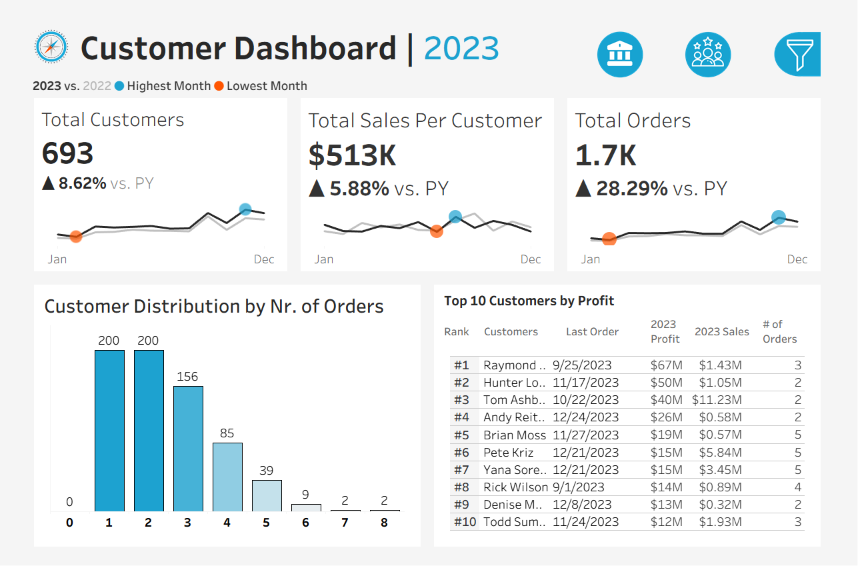
A Tableau business intelligence project analyzing 2023 sales and customer performance against the previous year, with KPI summaries, subcategory performance, trend views, customer distribution, and top-customer profit insights.
2023 KPI Snapshot
Main dashboard measures comparing 2023 performance against the previous year.
Dashboard Views
The workbook includes dedicated views for sales performance and customer performance.
Analysis Coverage
- Sales, profit, and quantity KPI tracking with current-year versus previous-year comparison.
- Subcategory-level sales and profit analysis to identify stronger and weaker product areas.
- Sales and profit trend views highlighting above-average and below-average periods.
- Customer distribution by number of orders and top customers ranked by profit.
Workbook Details
- Built in Tableau with two dashboard tabs: Sales Dashboard and Customer Dashboard.
- Packaged workbook includes a Hyper extract and source tables for orders, customers, products, and location.
- Uses a year selection parameter set to 2023 for current-year KPI comparisons.
- Includes dashboard navigation and filter controls for category, subcategory, region, state, and city.
Dashboard PDF Preview
Embedded from the provided Tableau dashboard PDF export.
Business Value
- Supports sales performance monitoring through clear KPI comparison against the previous year.
- Helps identify product subcategories that drive sales and profit outcomes.
- Highlights customer concentration and ordering patterns for better follow-up and retention decisions.